
 TrapMetrics
Trap 5 is the weakest trap in British greyhound racing
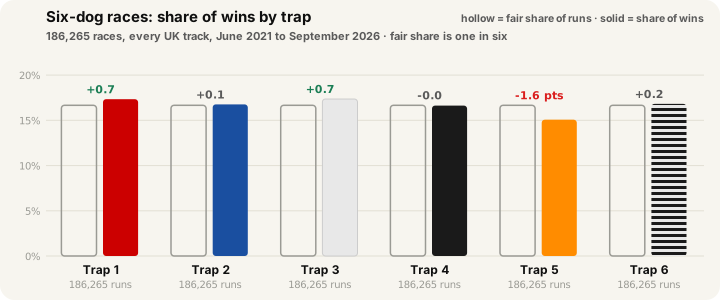
In 186,265 six-dog races since June 2021, trap 5 won 15.1% against a fair share of 16.7%. It is below its share at 21 of 23 tracks and in every one of six seasons. The market already knows.
Ask any regular which trap they distrust and you will hear a number. Ask for the evidence and you will usually get a feeling. This piece is the count: every six-dog race at every British track since June 2021, with the sample, the fair share, the season-by-season record and the one thing most trap statistics leave out, which is whether the market already knows.
The number
In 186,265 six-dog races from 1 June 2021 to 27 September 2026, trap 5 won 28,078, which is 15.07% of them. The fair share, one in six, is 16.67%. The 95% interval on that 15.07% runs from 14.91% to 15.24%, so the shortfall of 1.6 points is not a sampling accident; on a sample this size, noise is about a sixth of a point.
The count includes only races in which six dogs actually ran and exactly one was declared the winner. Races where a dog was withdrawn after the card (35,267 of them) are excluded, because a five-dog race has five fair shares, not six. That is the second question every trap statistic needs, and it is worth reading the fair share piece if the distinction is new.
| Trap | Share of wins | Against fair share |
|---|---|---|
| 1 | 17.3% | +0.7 |
| 2 | 16.8% | +0.1 |
| 3 | 17.4% | +0.7 |
| 4 | 16.6% | −0.1 |
| 5 | 15.1% | −1.6 |
| 6 | 16.8% | +0.2 |
The two inside traps and trap 3 pick up what trap 5 gives away. Traps 2, 4 and 6 sit within a fifth of a point of their share. There is one outlier in this table, and it is not at the rail or on the outside.
It holds every season
A pattern that appears in one year and vanishes in the next is a pattern found by looking. This one does not move.
| Season | Trap 5 share of wins |
|---|---|
| 2021 (from June) | 14.7% |
| 2022 | 14.9% |
| 2023 | 15.3% |
| 2024 | 14.9% |
| 2025 | 15.4% |
| 2026 (to 27 Sep) | 15.4% |
Six seasons, none above 15.4%, none within a point of the fair share. Whatever causes it is a feature of how six dogs are drawn and how they race, not of a particular year's dogs or tracks.
It holds at 21 of 23 tracks
The stronger test is by track, because trap bias is usually a track story: the length of the run-up, the tightness of the first bend, the grading of the surface. If trap 5 were weak only at a few tracks with awkward geometry, the national figure would be an average of a real effect and no effect. It is not.
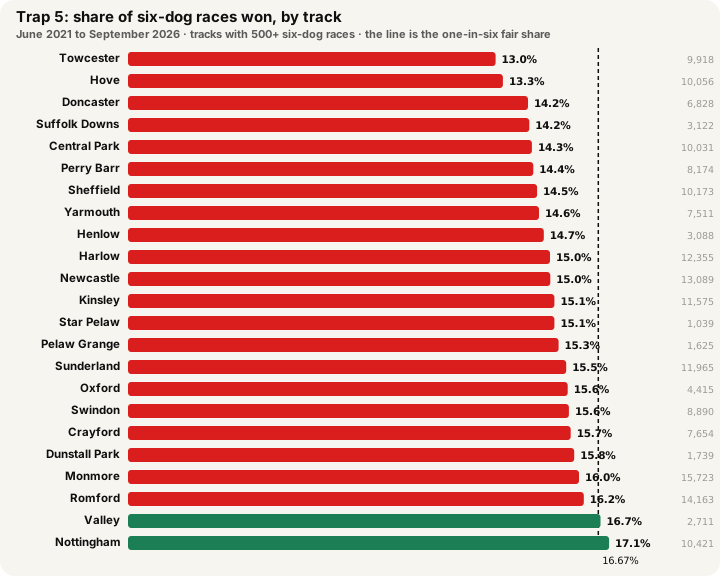
Of the 23 tracks with at least 500 six-dog races, 21 have trap 5 below its fair share. The weakest are Towcester at 13.0% (9,918 races) and Hove at 13.3% (10,056), then Doncaster at 14.2%. The two exceptions are Nottingham at 17.1% (10,421 races), where trap 5 is a genuine plus, and Valley at 16.7% (2,711 races), which is level with its share on the smallest sample of the 23. Each track has its own measured page, with every trap and every distance, under track pages.
Distance makes almost no difference. Trap 5 wins 14.9% of sprints under 300 metres, 15.9% of 400-metre races, 14.9% at the standard 480 to 520 metres and 14.9% at 570 to 700. The effect is not a run-up effect.
What it does not mean
It does not mean back the other traps, and it does not mean lay trap 5. This is the part most trap statistics leave out, and it is the part that decides whether the number is worth anything to a bettor.
We measured the return on backing every runner in each trap at Betfair SP across the same races, with 2% commission. Trap 5 came out at −0.9%, the best of the six; the others ranged from −1.7% to −3.5%. The ratio of trap-5 winners to the number the market expected was 1.015, meaning the market leans slightly too far against trap 5, by about a point and a half of its price. In plain terms: the market has known about this for years, has priced it in, and has if anything overdone it. Backing against trap 5 buys you nothing, and backing trap 5 because the market overdoes it is worth about a penny in the pound before you have found a bet.
That is the general lesson of trap statistics, and this is the cleanest case we have for it. A bias this large, this stable and this consistent across tracks is still fully inside the price by the off. A bias you read about on a forum, measured on 400 races at one track, is not going to be an exception.
Why trap 5?
The data shows the effect. It does not show the cause, and we would rather say so than invent one. Two explanations are consistent with what we can see.
The first is seeding. Draws are not random: railers are drawn low, wide runners high, and the middle traps take the dogs with no strong preference or the dogs left over once the seeded ones are placed. If trap 5 is where the least-preferred dogs land more often than trap 4 is, its shortfall is partly a quality effect rather than a positional one. Our ratings, which know each dog's running style and form, absorb about half of it: on the 5,785 six-dog races we have rated live since June 2026, the ratings expected trap 5 to win 15.9% of races, against the 16.7% fair share; the market expected 14.9%; trap 5 won 14.9%. So roughly half the shortfall is the dogs drawn there, and half is something about being drawn there.
The second is the first bend. A middle-drawn dog with early pace has rivals on both sides; a middle-drawn dog without it meets traffic from both sides. Trap 4 has the same problem in principle, and does not show the effect, which is why we are not confident the bend alone explains it. Our race comments data records crowding and baulking, and a proper test of the bend hypothesis by trap is on the research list. Until it has been run, "the first bend" is a hypothesis, not a finding.
How to use it
Read a trap-5 runner's rating with the shortfall in mind, and then check the market, which already has. If you build systems in the System Builder, a trap-5 filter will show you exactly what this piece shows: fewer wins, and no return, because the price moved first. The value of a number like this is not a bet. It is knowing which of the trap stories you hear are real, which are noise, and that the real ones are already in the price.
Source: GBGB results for every British track, 1 June 2021 to 27 September 2026, 186,265 six-dog races in which six dogs ran and one winner was declared; Betfair SP from Betfair's published files. Recomputed each morning by TrapMetrics; figures in this piece are as of 28 September 2026.
Questions this piece answers
Which trap wins the most in British greyhound racing?
Traps 3 and 1, just. In 186,265 six-dog races from June 2021 to September 2026, trap 3 won 17.4% and trap 1 17.3%, against a fair share of 16.7%. Trap 5 is the outlier at the other end on 15.1%. The differences between the other four traps are small.
Is trap 5 weak at every track?
At 21 of the 23 tracks with at least 500 six-dog races. Towcester (13.0%) and Hove (13.3%) are the weakest. Nottingham (17.1%) and Valley (16.7%) are the two exceptions, and Valley's sample is the smallest of the 23.
Should I back or lay trap 5?
No. The Betfair market already prices it: backing every trap-5 runner at Betfair SP returns about the same as backing any other trap, and if anything slightly better, because the market leans a little too far against it. A trap statistic tells you where to look, never what to bet.
Why is trap 5 weak?
The honest answer is that the data shows the effect, not the cause. The likeliest reasons are how draws are seeded (railers low, wide runners high, with the middle traps taking dogs with no strong preference) and the crowding a middle-drawn dog meets at the first bend. We can measure the first; we cannot yet measure the second.